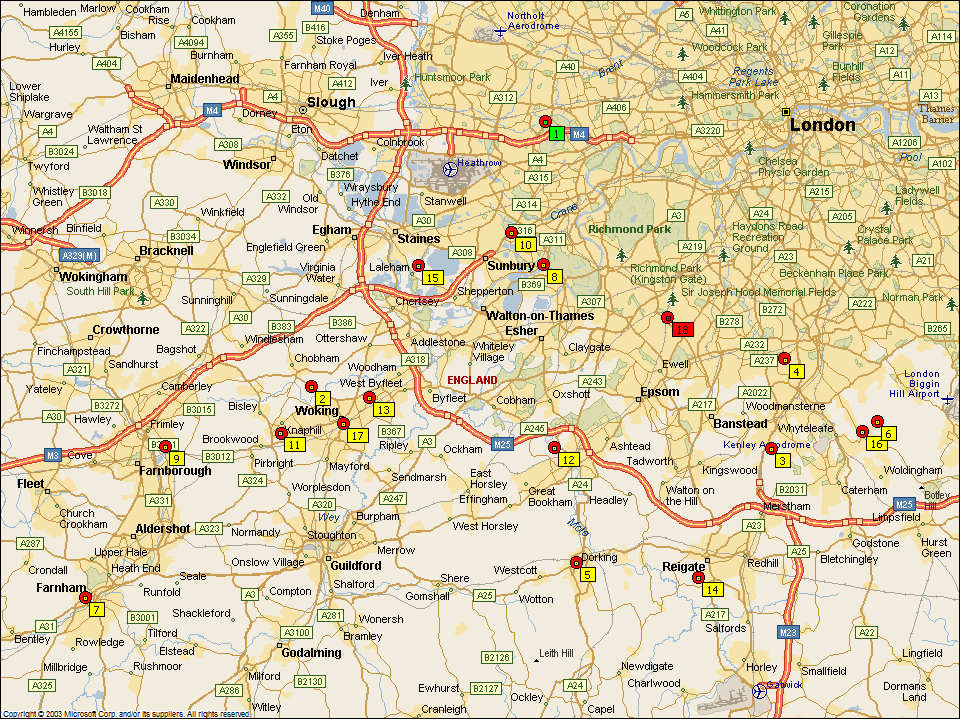
| Combined Counties Division One | ||||||||||||||||||||||
| Team | Max | Min | Total | CB | Cho | Cou | Cre | Dor | Frl | Frn | Fel | Fri | Han | Kna | Mol | She | Sou | Sta | War | Wes | Wor | |
| 1 | CB Hounslow United | 41 | 5 | 375 | x | 21 | 41 | 19 | 33 | 24 | 34 | 5 | 27 | 5 | 26 | 18 | 20 | 36 | 9 | 24 | 20 | 13 |
| 2 | Chobham | 37 | 3 | 317 | 21 | x | 31 | 29 | 24 | 37 | 16 | 18 | 9 | 16 | 5 | 13 | 3 | 27 | 10 | 36 | 3 | 19 |
| 3 | Coulsdon United | 41 | 5 | 422 | 41 | 31 | x | 5 | 15 | 8 | 40 | 37 | 41 | 36 | 33 | 18 | 27 | 11 | 30 | 7 | 31 | 11 |
| 4 | Crescent Rovers | 40 | 5 | 340 | 19 | 29 | 5 | x | 16 | 7 | 38 | 20 | 40 | 17 | 31 | 15 | 25 | 15 | 20 | 7 | 29 | 7 |
| 5 | Dorking | 33 | 8 | 337 | 33 | 24 | 15 | 16 | x | 20 | 25 | 16 | 33 | 28 | 19 | 8 | 20 | 8 | 22 | 19 | 17 | 14 |
| 6 | Farleigh Rovers | 47 | 1 | 465 | 24 | 37 | 8 | 7 | 20 | x | 44 | 42 | 47 | 41 | 38 | 23 | 33 | 16 | 35 | 1 | 35 | 14 |
| 7 | Farnham Town | 44 | 9 | 476 | 34 | 16 | 40 | 38 | 25 | 44 | x | 31 | 9 | 28 | 13 | 28 | 17 | 35 | 28 | 44 | 15 | 31 |
| 8 | Feltham | 42 | 4 | 353 | 5 | 18 | 37 | 20 | 16 | 42 | 31 | x | 23 | 4 | 20 | 11 | 17 | 33 | 5 | 41 | 17 | 13 |
| 9 | Frimley Green | 47 | 6 | 441 | 27 | 9 | 41 | 40 | 33 | 47 | 9 | 23 | x | 22 | 6 | 30 | 11 | 37 | 21 | 46 | 9 | 30 |
| 10 | Hanworth Villa | 41 | 4 | 361 | 5 | 16 | 36 | 17 | 28 | 41 | 28 | 4 | 22 | x | 21 | 24 | 15 | 32 | 6 | 40 | 16 | 10 |
| 11 | Knaphill | 38 | 3 | 337 | 26 | 5 | 33 | 31 | 19 | 38 | 13 | 20 | 6 | 21 | x | 15 | 6 | 29 | 13 | 38 | 3 | 21 |
| 12 | Mole Valley SCR | 30 | 8 | 290 | 18 | 13 | 18 | 15 | 8 | 23 | 28 | 11 | 30 | 24 | 15 | x | 11 | 15 | 14 | 23 | 13 | 11 |
| 13 | Sheerwater | 33 | 3 | 289 | 20 | 3 | 27 | 25 | 20 | 33 | 17 | 17 | 11 | 15 | 6 | 11 | x | 23 | 10 | 32 | 3 | 16 |
| 14 | South Park | 37 | 8 | 398 | 36 | 27 | 11 | 15 | 8 | 16 | 35 | 33 | 37 | 32 | 29 | 15 | 23 | x | 26 | 15 | 27 | 13 |
| 15 | Staines Lammas | 35 | 5 | 307 | 9 | 10 | 30 | 20 | 22 | 35 | 28 | 5 | 21 | 6 | 13 | 14 | 10 | 26 | x | 35 | 10 | 13 |
| 16 | Warlingham | 46 | 1 | 457 | 24 | 36 | 7 | 7 | 19 | 1 | 44 | 41 | 46 | 40 | 38 | 23 | 32 | 15 | 35 | x | 35 | 14 |
| 17 | Westfield | 35 | 3 | 301 | 20 | 3 | 31 | 29 | 17 | 35 | 15 | 17 | 9 | 16 | 3 | 13 | 3 | 27 | 10 | 35 | x | 18 |
| 18 | Worcester Park | 31 | 7 | 268 | 13 | 19 | 11 | 7 | 14 | 14 | 31 | 13 | 30 | 10 | 21 | 11 | 16 | 13 | 13 | 14 | 18 | x |
| Overall | 476 | 268 | 363 | |||||||||||||||||||
| NB. All mileages are based on quickest driving times using Microsoft Autoroute | ||||||||||||||||||||||


