

| Northern Premier Premier Division | ||||||||||||||||||||||||||
| Team | Max | Min | Total | Ash | Bos | Bra | Bux | Cam | Eas | FC | Fri | Gui | Hed | Ilk | Ken | Lei | Mar | Mat | Nan | Nor | Oss | Pre | Whi | Wit | Wor | |
| 1 | Ashton United | 112 | 16 | 1,185 | x | 111 | 34 | 23 | 50 | 70 | 16 | 58 | 38 | 80 | 75 | 82 | 25 | 54 | 40 | 51 | 86 | 33 | 42 | 112 | 34 | 71 |
| 2 | Boston United | 205 | 62 | 2,482 | 111 | x | 111 | 92 | 173 | 67 | 139 | 82 | 113 | 125 | 63 | 205 | 148 | 176 | 74 | 125 | 73 | 101 | 165 | 136 | 141 | 62 |
| 3 | Bradford Park Avenue | 114 | 11 | 1,370 | 34 | 111 | x | 61 | 71 | 74 | 37 | 32 | 11 | 114 | 79 | 102 | 46 | 74 | 72 | 85 | 60 | 16 | 63 | 90 | 63 | 75 |
| 4 | Buxton | 128 | 20 | 1,203 | 23 | 92 | 61 | x | 64 | 36 | 40 | 64 | 69 | 56 | 38 | 101 | 40 | 66 | 20 | 38 | 92 | 49 | 55 | 128 | 31 | 40 |
| 5 | Cammell Laird | 173 | 10 | 1,707 | 50 | 173 | 71 | 64 | x | 137 | 41 | 95 | 78 | 88 | 141 | 83 | 28 | 10 | 82 | 34 | 123 | 73 | 15 | 152 | 32 | 137 |
| 6 | Eastwood Town | 168 | 3 | 1,640 | 70 | 67 | 74 | 36 | 137 | x | 102 | 50 | 76 | 56 | 3 | 168 | 112 | 140 | 18 | 66 | 78 | 57 | 128 | 130 | 66 | 6 |
| 7 | FC United of Manchester | 139 | 16 | 1,329 | 16 | 139 | 37 | 40 | 41 | 102 | x | 60 | 44 | 84 | 107 | 73 | 16 | 44 | 57 | 55 | 88 | 38 | 33 | 118 | 34 | 103 |
| 8 | Frickley Athletic | 126 | 16 | 1,454 | 58 | 82 | 32 | 64 | 95 | 50 | 60 | x | 34 | 103 | 55 | 126 | 70 | 98 | 50 | 109 | 45 | 16 | 86 | 83 | 87 | 51 |
| 9 | Guiseley | 123 | 11 | 1,416 | 38 | 113 | 11 | 69 | 78 | 76 | 44 | 34 | x | 123 | 81 | 61 | 54 | 82 | 76 | 93 | 63 | 22 | 70 | 79 | 72 | 77 |
| 10 | Hednesford Town | 196 | 42 | 1,903 | 80 | 125 | 114 | 56 | 88 | 56 | 84 | 103 | 123 | x | 42 | 136 | 73 | 92 | 47 | 46 | 131 | 117 | 80 | 196 | 56 | 58 |
| 11 | Ilkeston Town | 173 | 3 | 1,697 | 75 | 63 | 79 | 38 | 141 | 3 | 107 | 55 | 81 | 42 | x | 173 | 116 | 144 | 19 | 64 | 83 | 62 | 133 | 135 | 74 | 10 |
| 12 | Kendal Town | 205 | 61 | 2,384 | 82 | 205 | 102 | 101 | 83 | 168 | 73 | 126 | 61 | 136 | 173 | x | 65 | 77 | 122 | 106 | 154 | 104 | 80 | 112 | 85 | 169 |
| 13 | Leigh Genesis | 148 | 16 | 1,352 | 25 | 148 | 46 | 40 | 28 | 112 | 16 | 70 | 54 | 73 | 116 | 65 | x | 29 | 58 | 44 | 98 | 48 | 20 | 127 | 23 | 112 |
| 14 | Marine | 176 | 10 | 1,772 | 54 | 176 | 74 | 66 | 10 | 140 | 44 | 98 | 82 | 92 | 144 | 77 | 29 | x | 84 | 49 | 126 | 76 | 14 | 156 | 41 | 140 |
| 15 | Matlock Town | 129 | 18 | 1,278 | 40 | 74 | 72 | 20 | 82 | 18 | 57 | 50 | 76 | 47 | 19 | 122 | 58 | 84 | x | 52 | 76 | 57 | 73 | 129 | 51 | 21 |
| 16 | Nantwich Town | 167 | 17 | 1,552 | 51 | 125 | 85 | 38 | 34 | 66 | 55 | 109 | 93 | 46 | 64 | 106 | 44 | 49 | 52 | x | 137 | 87 | 51 | 167 | 17 | 76 |
| 17 | North Ferriby United | 154 | 45 | 1,941 | 86 | 73 | 60 | 92 | 123 | 78 | 88 | 45 | 63 | 131 | 83 | 154 | 98 | 126 | 76 | 137 | x | 52 | 115 | 67 | 115 | 79 |
| 18 | Ossett Town | 117 | 16 | 1,278 | 33 | 101 | 16 | 49 | 73 | 57 | 38 | 16 | 22 | 117 | 62 | 104 | 48 | 76 | 57 | 87 | 52 | x | 64 | 82 | 66 | 58 |
| 19 | Prescot Cables | 165 | 14 | 1,589 | 42 | 165 | 63 | 55 | 15 | 128 | 33 | 86 | 70 | 80 | 133 | 80 | 20 | 14 | 73 | 51 | 115 | 64 | x | 144 | 29 | 129 |
| 20 | Whitby Town | 196 | 67 | 2,619 | 112 | 136 | 90 | 128 | 152 | 130 | 118 | 83 | 79 | 196 | 135 | 112 | 127 | 156 | 129 | 167 | 67 | 82 | 144 | x | 145 | 131 |
| 21 | Witton Albion | 145 | 17 | 1,363 | 34 | 141 | 63 | 31 | 32 | 66 | 34 | 87 | 72 | 56 | 74 | 85 | 23 | 41 | 51 | 17 | 115 | 66 | 29 | 145 | x | 101 |
| 22 | Worksop Town | 169 | 6 | 1,706 | 71 | 62 | 75 | 40 | 137 | 6 | 103 | 51 | 77 | 58 | 10 | 169 | 112 | 140 | 21 | 76 | 79 | 58 | 129 | 131 | 101 | x |
| 2,619 | 1,185 | 1,646 | ||||||||||||||||||||||||
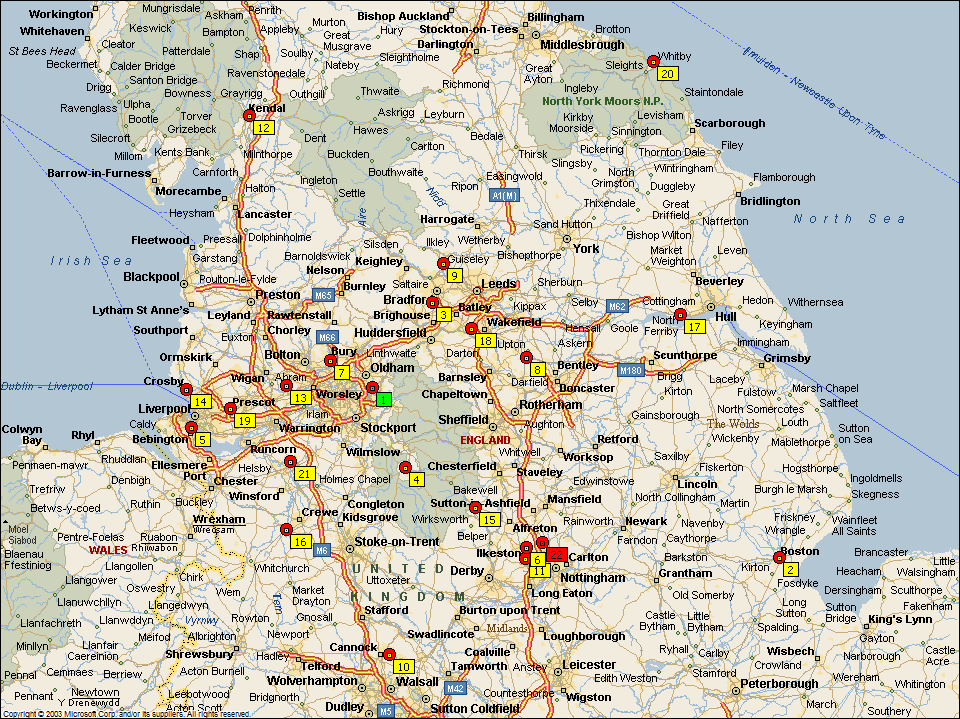
| NB. All mileages are based on quickest driving times using Microsoft Autoroute | ||||||||||||||||||||||||||